Fun with console-log() 💿 - DEV Community 👩💻👨💻
本文由 简悦 SimpRead 转码, 原文地址 dev.to
A constructive and inclusive social network for software developers. With you every step of your jour......
If you've ever developed a web app, you'll be familiar with console.log(...), the method which prints data to the developer console; useful for debugging, logging and testing.
Run console.log(console), and you'll see that there's much more to the console object.
This post briefly outlines the top 10 neat tricks you can use to level up your logging experience.
Contents
- Tables
- Groups
- Styles
- Times
- Asserts
- Counts
- Traces
- Directory
- Debugs
- Log Levels
- Multi-Values
- Log Strings
- Clear
- Special Browser Methods
Tables
The console.table() method prints objects/ arrays as a neatly formatted tables.
console.table({
  'Time Stamp': new Date().getTime(),
  'OS': navigator['platform'],
  'Browser': navigator['appCodeName'],
  'Language': navigator['language'],
});
Groups
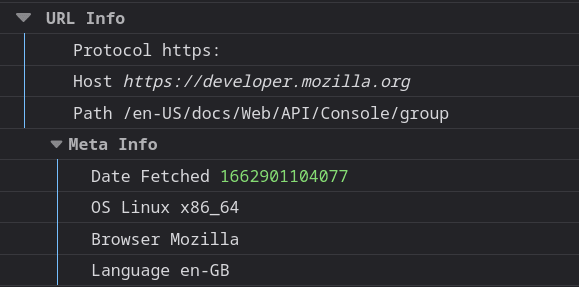
Group related console statements together with collapsible sections, using console.group().
You can optionally give a section a title, by passing a string as the parameter. Sections can be collapsed and expanded in the console, but you can also have a section collapsed by default, by using groupCollapsed instead of group. You can also nest sub-sections within sections but be sure to remember to close out each group with groupEnd.
The following example will output an open section, containing some info
console.group('URL Info');
  console.log('Protocol', window.location.protocol);
  console.log('Host', window.origin);
  console.log('Path', window.location.pathname);
  console.groupCollapsed('Meta Info');
    console.log('Date Fetched', new Date().getTime());
    console.log('OS', navigator['platform']);
    console.log('Browser', navigator['appCodeName']);
    console.log('Language', navigator['language']);
  console.groupEnd();
console.groupEnd();
Styled Logs
It's possible to style your log outputs with some basic CSS, such as colors, fonts, text styles and sizes. Note that browser support for this is quite variable.
For example, try running the following:
console.log(
  '%cHello World!',
  'color: #f709bb; font-family: sans-serif; text-decoration: underline;'
);
You should get the following output:
Pretty cool, huh? Well there's a lot more you can do too!
Maybe change the font, style, background color, add some shadows and some curves...
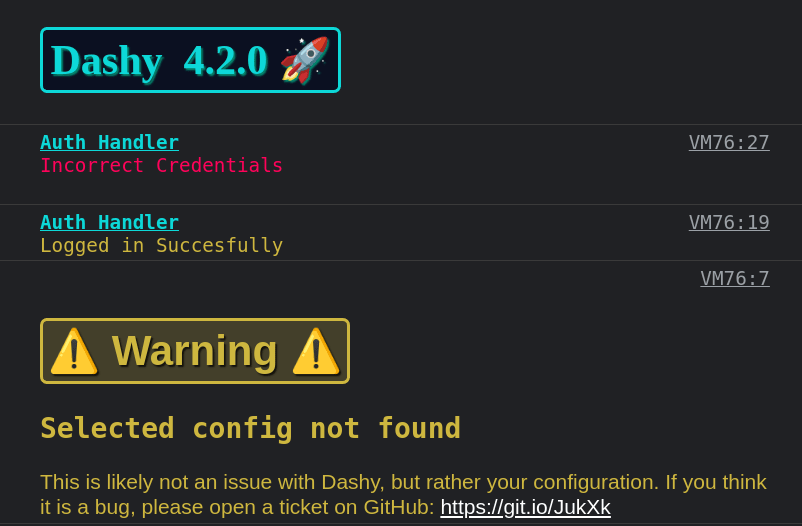
Here's something similar I'm using in a developer dashboard, the code is here
Time
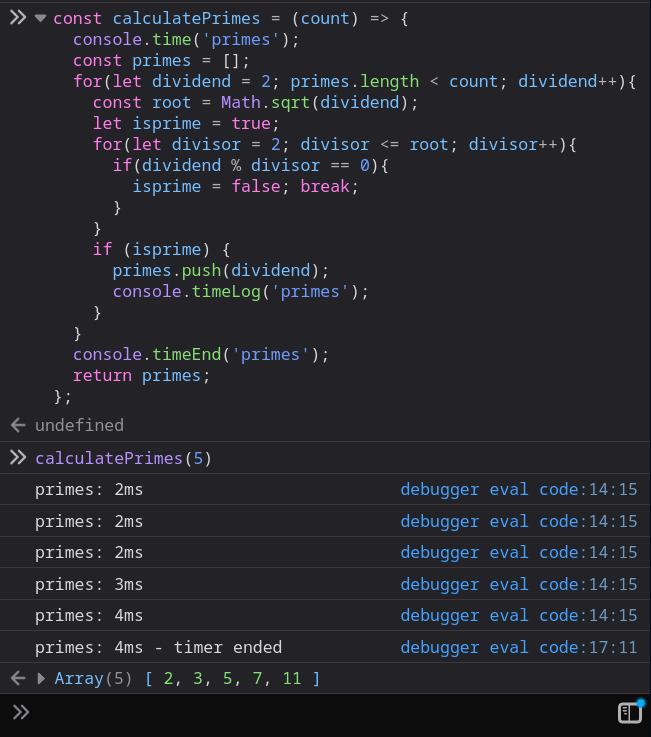
Another common debugging technique is measuring execution time, to track how long an operation takes. This can be achieved by starting a timer using console.time() and passing in a label, then ending the timer using console.timeEnd(), using the same label. You can also add markers within a long running operation using console.timeLog()
console.time("concatenation");
let output = "";
for (var i = 1; i <= 1e6; i++) {
  output += i;
}
console.timeEnd("concatenation");
concatenation: 1206ms - timer ended
There's also a non-standard method, console.timeStamp() which adds markers within the performance tab, so you can correlate points in your code with the other events recorded in the timeline like paint and layout events.
Assert
You may only want to log to the console if an error occurs, or a certain condition is true or false. This can be done using console.assert(), which won't log anything to the console unless the first parameter is false.
The first parameter is a boolean condition to check, followed by 0 or more data points you'd like to print, and the last parameter is a message to output. So console.assert(false, 'Value was false') will output the message, since the first parameter is false.
const errorMsg = 'the # is not even';
for (let num = 2; num <= 5; num++) {
  console.log(`the # is ${num}`);
  console.assert(num % 2 === 0, { num }, errorMsg);
}
Count
Ever find yourself manually incrementing a number for logging? console.count() is helpful for keeping track how many times something was executed, or how often a block of code was entered.
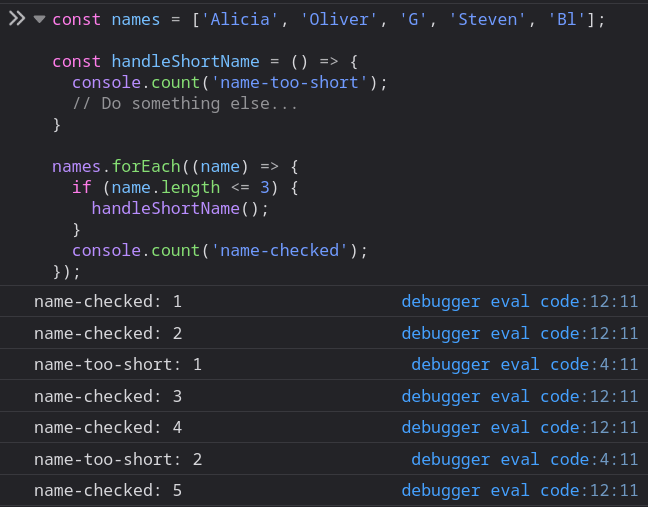
You can optionally give your counter a label, which will let you manage multiple counters and make the output clearer.
Counters will always start from 1. You can reset a counter at anytime with console.countReset(), which also takes an optional label parameter.
The following code will increment the counter for each item in the array, the final value will be 8.
const numbers = [1, 2, 3, 30, 69, 120, 240, 420];
numbers.forEach((name) => {
  console.count();
});
The following is an example output of labelled counters.
Instead of passing in a label, if you use a value, then you'll have a separate counter for each conditions value. For example:
console.count(NaN);         // NaN: 1
console.count(NaN+3);       // NaN: 2
console.count(1/0);         // Infinity: 1
console.count(String(1/0)); // Infinity: 2
Trace
In JavaScript, we're often working with deeply nested methods and objects. You can use console.trace() to traverse through the stack trace, and output which methods were called to get to a certain point.
You can optionally pass data to also be outputted along with the stacktrace.
Dir
If your logging a large object to the console, it may become hard to read. The console.dir() method will format it in an expandable tree structure.
The following is an example of a directory-style console output:
You can also print XML or HTML based trees in a similar way, by using console.dirxml().
Debug
You may have some logging set up within your app, that you rely on during development, but don't wish the user to see. Replacing log statements with console.debug() will do just this, it functions in exactly the same way as console.log but will be stripped out by most build systems, or disabled when running in production mode.
Log Levels
You may have noticed that there's several filters in the browser console (info, warnings and error), they allow you to change the verbosity of logged data. To make use of these filters, just switch out log statements with one of the following:
console.info()- Informational messages for logging purposes, commonly includes a small "i" and / or a blue backgroundconsole.warn()- Warnings / non-critical errors, commonly includes a triangular exclamation mark and / or yellow backgroundconsole.error()- Errors which may affect the functionality, commonly includes a circular exclamation mark and / or red background
In Node.js different log levels get written to different streams when running in production, for example error() will write to stderr, whereas log outputs to stdout, but during development they will all appear in the console as normal.
Multi-Value Logs
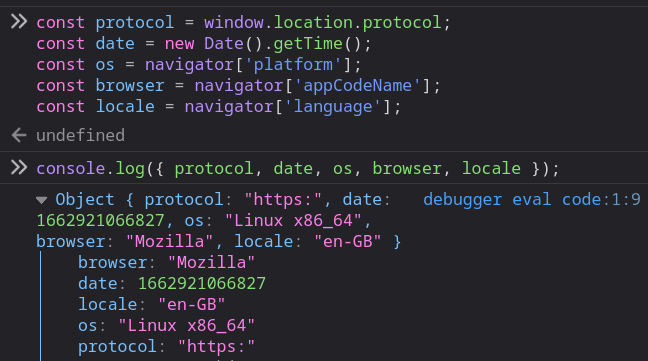
Most functions on the console object will accept multiple parameters, so you can add labels to your output, or print multiple data points at a time, for example: console.log('User: ', user.name);
But an easier approach for printing multiple, labelled values, is to make use of object deconstructing. For example, if you had three variables (e.g. x, y and z), you could log them as an object by surrounding them in curly braces, so that each variables name and value is outputted - like console.log( { x, y, z } );
Log String Formats
If you need to build formatted strings to output, you can do this with C-style printf using format specifiers.
The following specifiers are supported:
%s- String or any other type converted to string%d/%i- Integer%f- Float%o- Use optimal formatting%O- Use default formatting%c- Use custom formatting (more info)
For example
console.log("Hello %s, welcome to the year %d!", "Alicia", new Date().getFullYear());
// Hello Alicia, welcome to the year 2022!
Of course, you could also use template literals to achieve the same thing, which might be easier to read for shorter strings.
Clear
Finally, when you're looking for an output from an event, you might want to get rid of everything logged to the console when the page first loaded. This can be done with console.clear(), which will clear all content, but nor reset any data.
It's usually also possible to clear the console by clicking the Bin icon, as well as to search through it using the Filter text input.
Special Browser Methods
When running code directly in the browser's console, you'll have access to a couple of short-hand methods, which are super useful for debugging, automation and testing.
The most useful of which are:
$()- Short-hand forDocument.querySelector()(to select DOM elements, jQuery-style!)$$()- Same as above, but forselectAllfor when returning multiple elements in an array$_- Returns value of last evaluated expression$0- Returns the most recently selected DOM element (in the inspector)$1...$4can also be used to grab previously selected UI elements$x()- Lets you select DOM elements using an Xpath querykeys()andvalues()- Shorthand for Object.getKeys(), will return an array of either obj keys or valuescopy()- Copies stuff to the clipboardmonitorEvents()- Run command each time a given event is fireed- For certain common console commands (like
console.table()), you don't need to type the precedingconsole., just runtable()
There's many more console shorthand commands, here's a full list.
Warning These only work within the dev tools console, and will not work in your code!
And some more...
There's so much more that you can do with logging to the console! For more info, check out the MDN console Documentation or the Chrome Dev Console Docs.
Just a quick note about best practices...
- Define a lint rule, to prevent any console.log statements from being merged into your main branch
- Write a wrapper function to handle logging, that way you can enable / disable debug logs based on environment, as well as use appropriate log levels, and apply any formatting. This can also be used to integrate with a third-party logging service with code updates only needed in a single place
- Never log any sensitive info, the browser logs can be captured by any installed extensions, so should not be considered secure
- Always use the correct log levels (like
info,warn,error) to make filtering and disabling easier - Follow a consistent format, so logs can be parsed by a machine if needed
- Write short, meaningful log messages always in English
- Include the context or category within logs
- Don't overdo it, only log useful info

